ERP Tutorial 11 — Shipments, Lead Times & Reports: The Edges of the System
Ten tutorials covered the middle of the system — planning, building, stocking. This one covers its edges: Shipments going out, Supplier Lead Times coming in, and the Reports page watching both. Three pages, one theme: promises, and whether they're kept.
Shipments — Closing the Original Loop
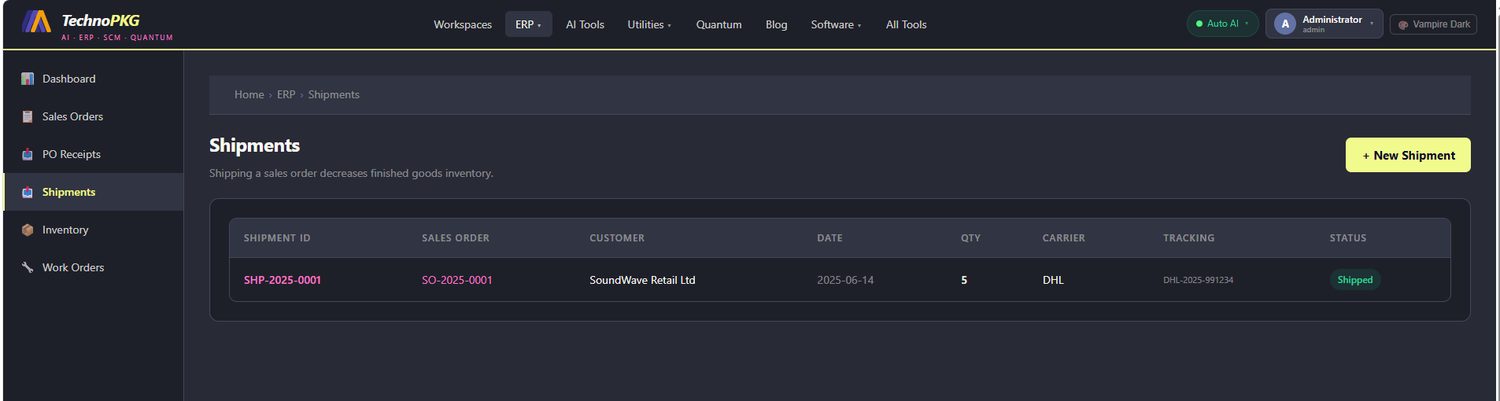
Open ERP → Shipments and the page states its rule up front: "Shipping a sales order decreases finished goods inventory." One shipment sits in the list, and it's a familiar one:
SHP-2025-0001 · SO-2025-0001 · SoundWave Retail Ltd · 2025-06-14 · Qty 5 · DHL · DHL-2025-991234 · Shipped
Follow the thread back through the series: SO-2025-0001 was the very first sales order (Tutorial 1); WO-2025-0001 built 10 units against it and put them into inventory (Tutorial 6); and here, 5 of them left the building with a carrier and a tracking number. Order → plan → build → stock → ship. This one table row is the whole plan-to-deliver cycle, completed — and the finished-goods stock it decremented is the same inventory position from Tutorial 3.
Supplier Lead Times & Performance
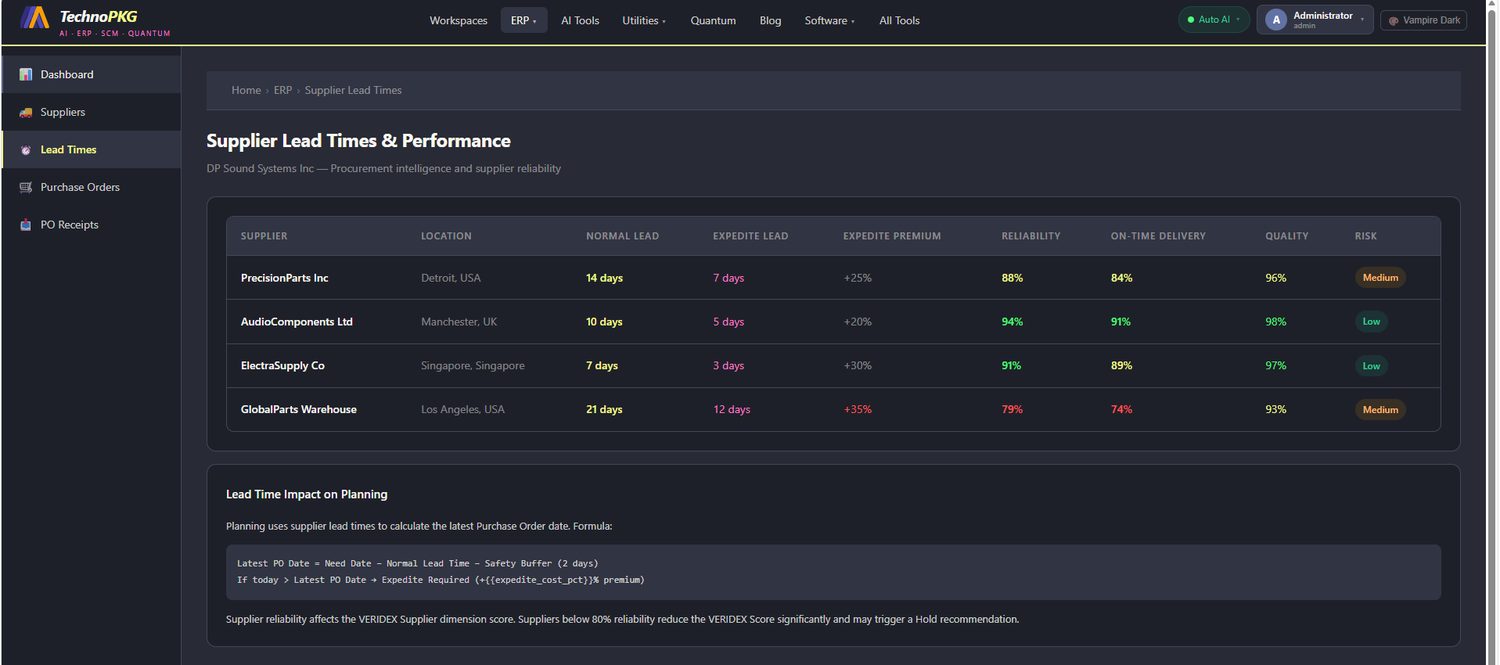
ERP → Lead Times is subtitled procurement intelligence and supplier reliability, and it upgrades the single lead-time number from the supplier cards (Tutorial 10) into a full scorecard:
| Supplier | Normal Lead | Expedite | Premium | Reliability | On-Time | Quality | Risk |
|---|---|---|---|---|---|---|---|
| PrecisionParts Inc | 14 days | 7 days | +25% | 88% | 84% | 96% | Medium |
| AudioComponents Ltd | 10 days | 5 days | +20% | 94% | 91% | 98% | Low |
| ElectraSupply Co | 7 days | 3 days | +30% | 91% | 89% | 97% | Low |
| GlobalParts Warehouse | 21 days | 12 days | +35% | 79% | 74% | 93% | Medium |
Two columns deserve a planner's full attention. Expedite lead + premium is the price of panic, quantified: PrecisionParts can halve its 14 days, but at +25% on the PO. And the reliability column carries a threshold the page states explicitly: suppliers below 80% reliability reduce the VERIDEX Score significantly and may trigger a Hold recommendation. Look down the column — GlobalParts Warehouse sits at 79%, one point under the line, with the longest lead (21 days) and the worst on-time rate (74%) to match. Remember that number; it comes back in the finale.
The page also publishes the planning formula that consumes this data:
Latest PO Date = Need Date − Normal Lead Time − Safety Buffer (2 days) — and if today is already past that date, the system flags Expedite Required with the supplier's premium attached. This is the exact arithmetic behind every purchase suggestion MRP made in Tutorial 4: the item's need date walked backwards through this table.
ERP Reports — the Rear-View Mirror
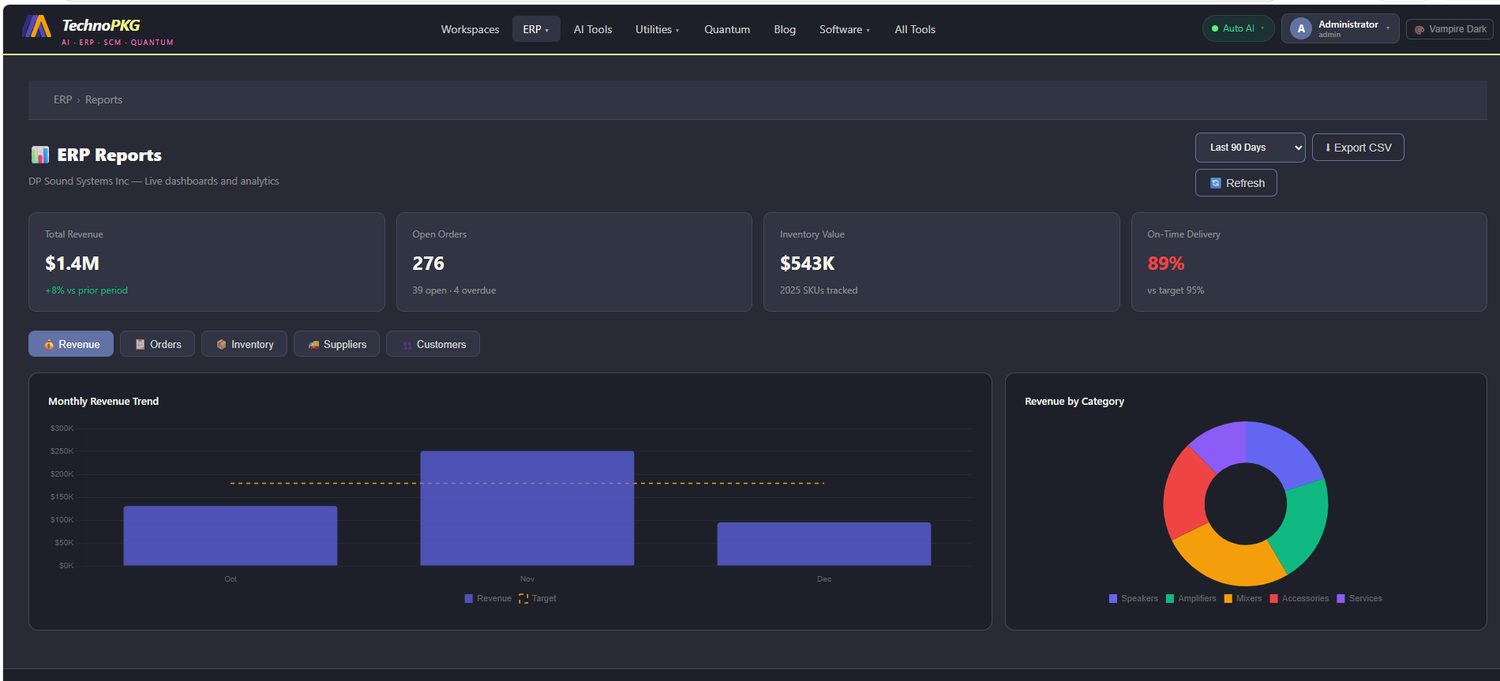
ERP → Reports is the live dashboard: a period selector (Last 90 Days), CSV export, and four headline KPIs:
- Total Revenue $1.4M, +8% vs prior period
- Open Orders 276, with 4 flagged overdue
- Inventory Value $543K across 2,025 tracked SKUs
- On-Time Delivery 89% — shown in red against a 95% target
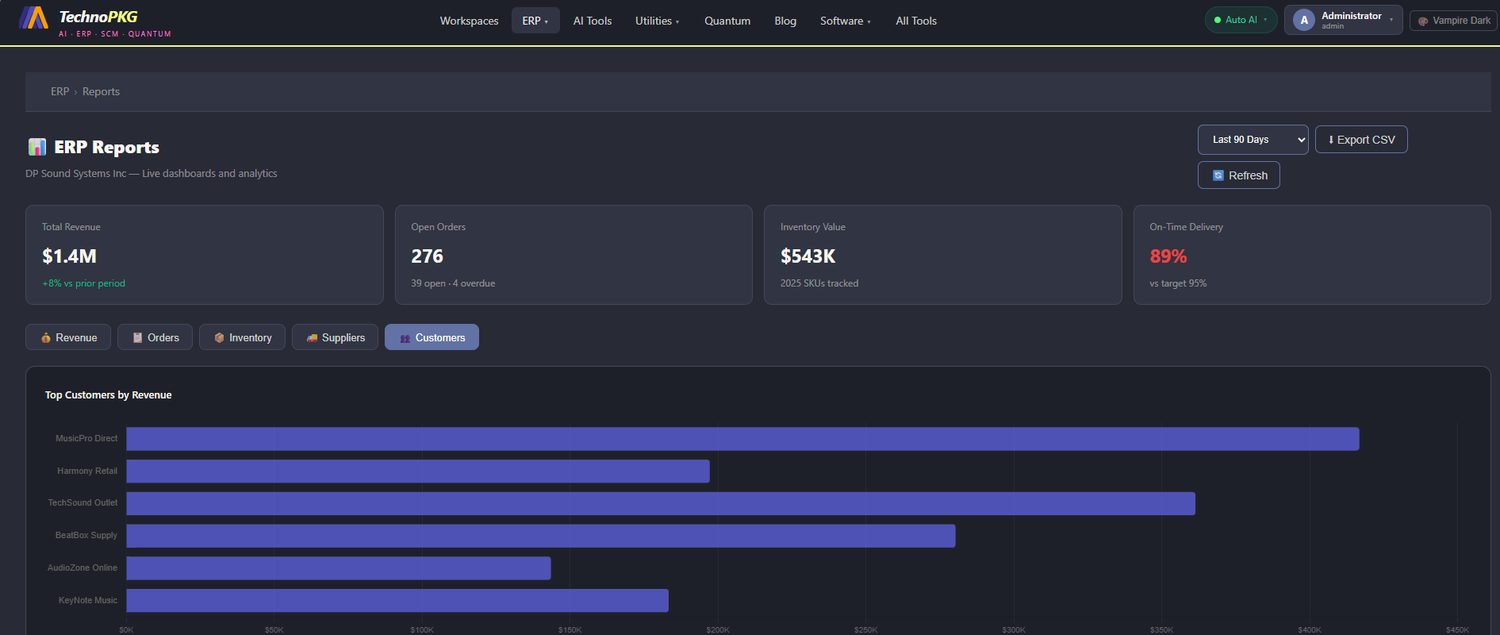
Five tabs slice the detail: Revenue, Orders, Inventory, Suppliers, Customers. The Revenue tab plots the monthly trend against a target line — November clears it comfortably while the neighbouring months fall short — next to a revenue-by-category donut (Speakers, Amplifiers, Mixers, Accessories, Services). The Customers tab ranks the book by revenue, with MusicPro Direct leading at roughly $400K and TechSound Outlet close behind.
Now connect the red KPI to the supplier table above. The company delivers on time 89% of the time — and its two Medium-risk suppliers deliver 84% and 74% of the time. Inbound unreliability leaks into outbound promises; a factory can't ship on time what its suppliers deliver late. One screen shows the symptom, the other names a cause. That's what dashboards are for.
Try It Yourself
- On Shipments, trace SHP-2025-0001 back through SO-2025-0001 and WO-2025-0001 across Tutorials 1 and 6 — the full cycle in three clicks.
- On Lead Times, compute what expediting a $10,000 GlobalParts order actually costs at +35% — then ask whether a more reliable supplier would have been cheaper.
- Apply the Latest-PO-Date formula: for a part needed on the 30th from PrecisionParts, when must the PO go out?
- On Reports, flip through all five tabs and find which category dominates the revenue donut.
Next up: the finale. Tutorial 12 — the VERIDEX Decision Workbench, where every page in this series becomes an input to a single score.
Comments (0)