ERP Tutorial 15 — MRP in Action: Running the Planning Engine
Tutorial 4 introduced Material Requirements Planning as a concept and walked its algorithms. This tutorial runs it on the live portal and shows exactly what changes when the engine executes — the Planning & MRP workbench under ERP, and the numbers it moves.
The Planning Dashboard
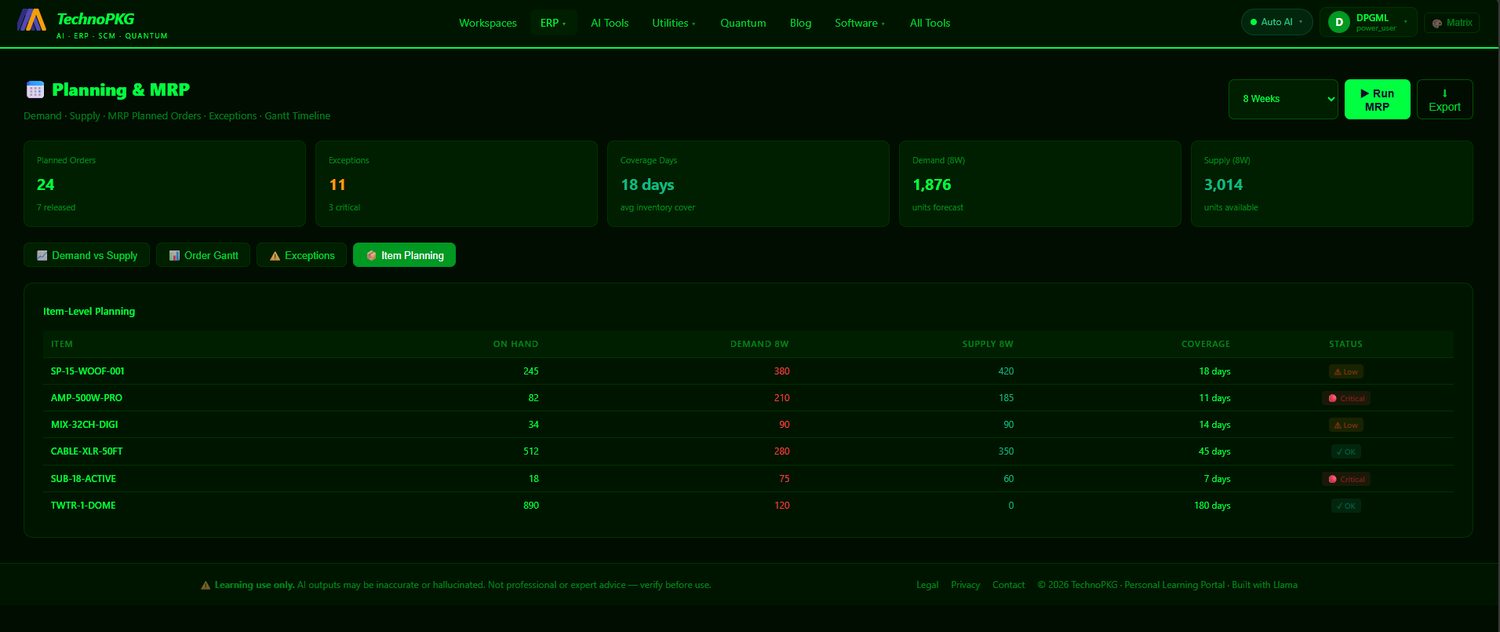
The workbench opens on a summary of the current plan: planned orders, exceptions, average coverage days, and the eight-week demand and supply totals. Below sit four views — Demand vs Supply, an order Gantt, an exceptions list, and the item-level planning table.
Running the Engine
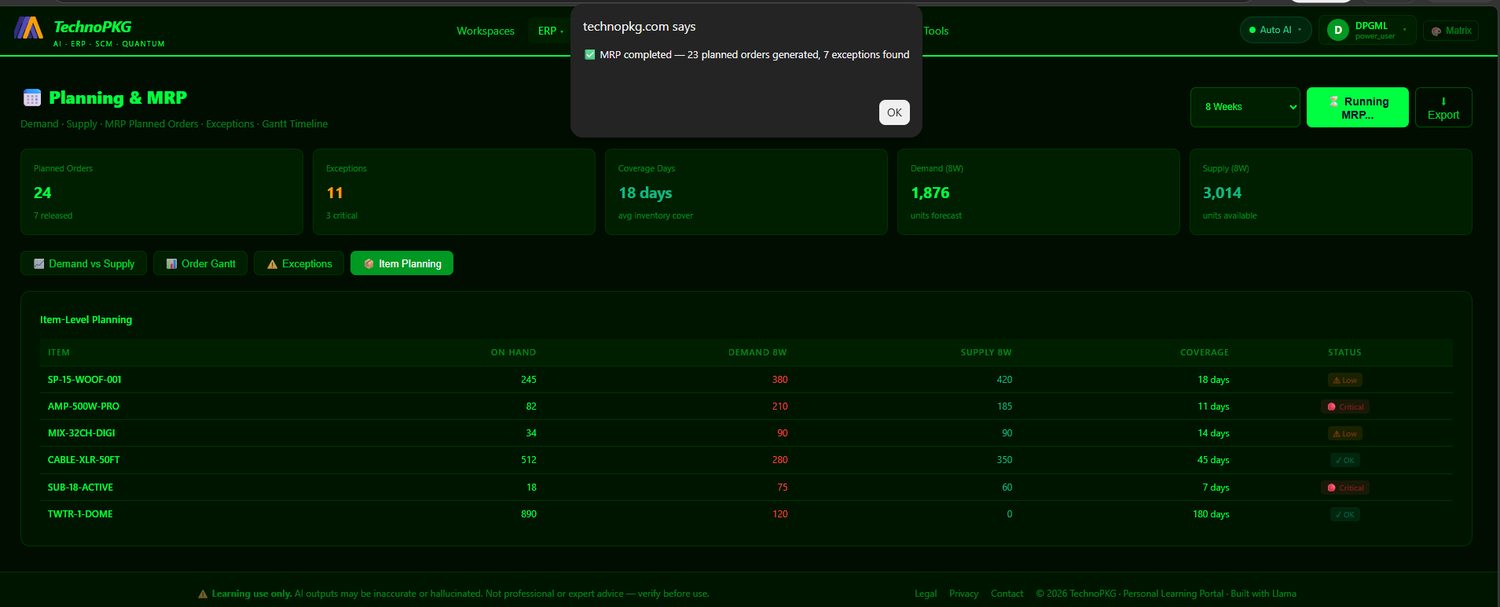
Selecting a horizon (here eight weeks) and pressing Run MRP executes the calculation across every planned item: netting demand against on-hand and scheduled supply, applying each item's lot-sizing rule and lead time, and generating planned orders plus exception messages where the plan cannot be satisfied.
What Changed
The re-run visibly moves the plan. Planned orders rise from 24 to 34, exceptions from 11 to 18 (4 now critical), and average coverage recalculates to 41 days as new supply is proposed further out.
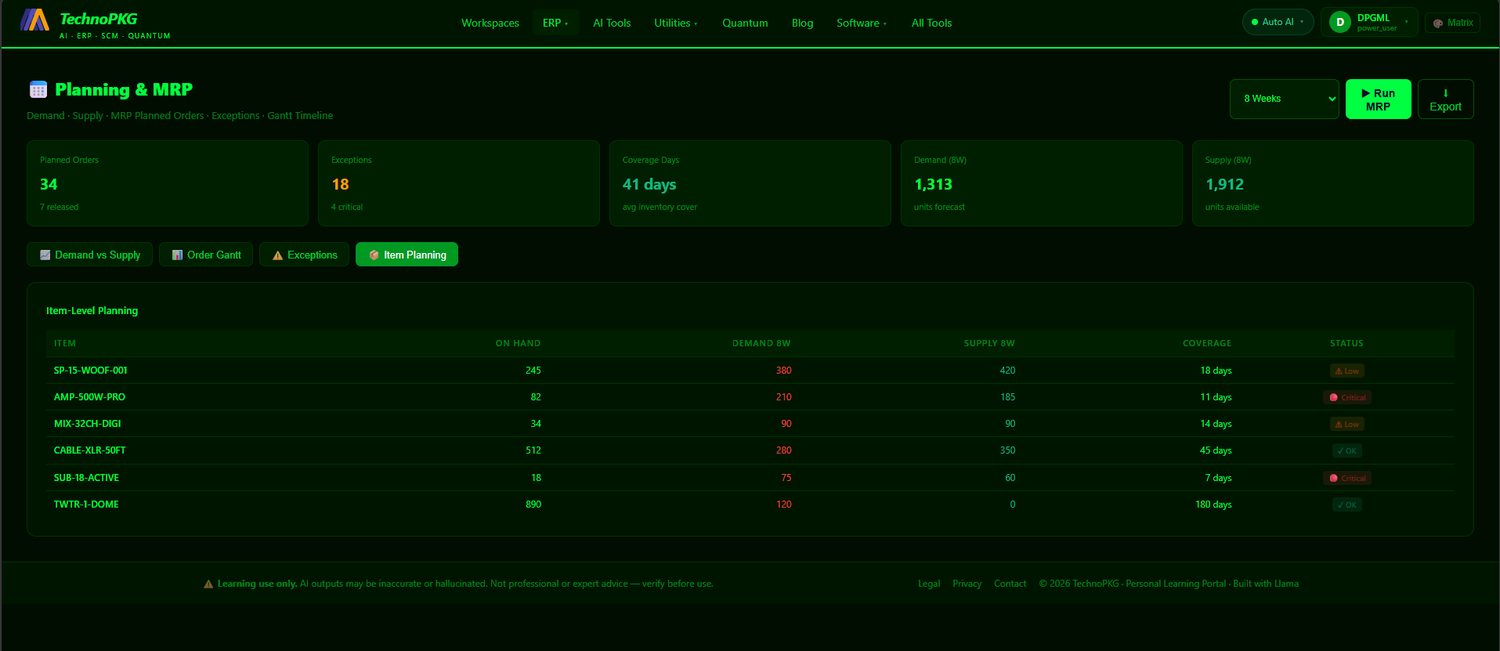
The item-level table is where a planner acts. Each row shows on-hand, eight-week demand, available supply, resulting coverage in days, and a status flag. Critical rows — where coverage falls below the safety threshold — are where planned orders and expedites get released. This is the demand signal from Tutorial 13's forecast, exploded through the BOMs of Tutorials 7 and 14, netted against inventory, and turned into action.
The Full Chain
With this tutorial the planning spine is complete end to end: Forecast (13) → S&OP (5) → MRP (15) → Work Orders (6) → Shipments (11). Demand is predicted, committed, exploded into net requirements, built, and shipped — each stage feeding the next, each visible on the portal.
Try It
- Open ERP → MRP Workbench, note the current planned-order and exception counts, then press Run MRP.
- Compare the summary tiles before and after — which direction did coverage move?
- Open Item Planning and find the Critical rows; those are the items a planner would action first.
- Switch to Exceptions and Demand vs Supply to see the same plan from different angles.
Comments (0)