ERP Tutorial 8 — Routings: Operations, Work Centres & the Cost of Time
Tutorial 7 covered the BOM — what goes into a SmartBar Pro 500. This tutorial covers its twin: the routing, which defines how it gets built — the operations, the sequence, the work centres, and the hours. Open ERP → Routings under Manufacturing.
The Routings Page
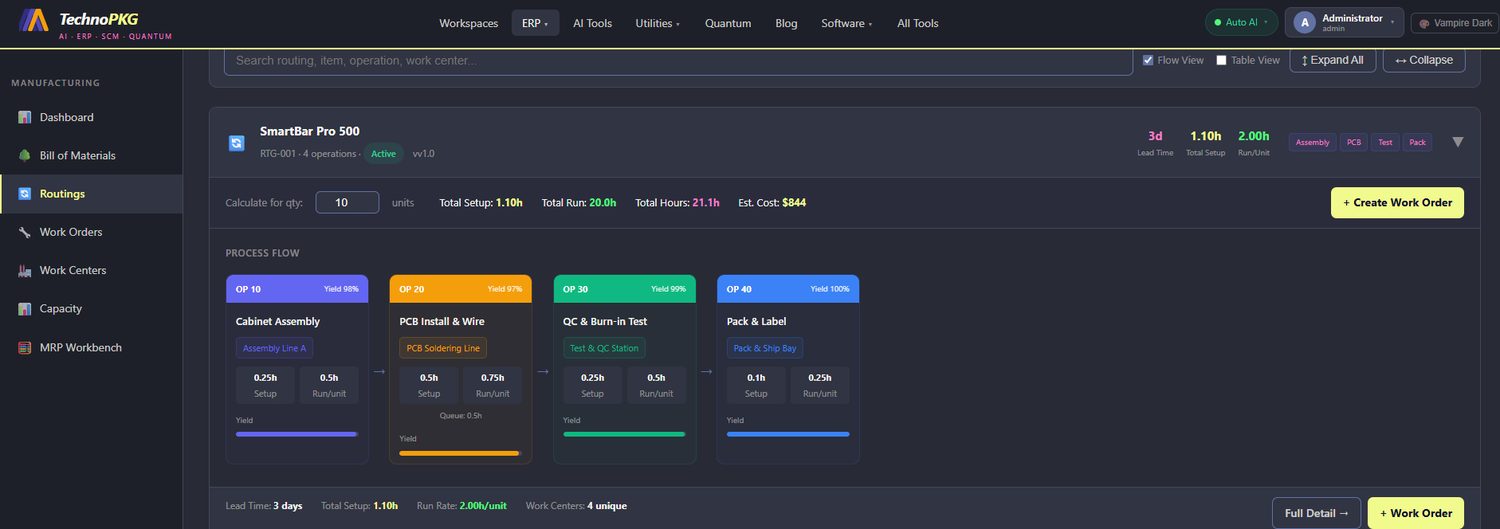
Like the BOM page, this one is built for exploring: a search box that reaches across routing, item, operation, and work centre (so "which routings touch the PCB Soldering Line?" is one query), a toggle between Flow View and Table View, and Expand All / Collapse controls. We'll read RTG-001 in Flow View — the visual mode that lays the process out left to right.
RTG-001 — SmartBar Pro 500, in One Header Row
The routing header compresses the whole story into a few numbers: RTG-001 · 4 operations · Active · v1.0, with Lead Time 3d · Total Setup 1.10h · Run/Unit 2.00h, and four work-centre tags — Assembly, PCB, Test, Pack. Before even expanding it, you know this product takes four stations, two hours of touch time per unit, and three days door to door.
The Process Flow
Expanded, the four operations appear as connected cards, each carrying its work centre, times, and yield:
| Op | Operation | Work Centre | Setup | Run/Unit | Yield |
|---|---|---|---|---|---|
| 10 | Cabinet Assembly | Assembly Line A | 0.25h | 0.5h | 98% |
| 20 | PCB Install & Wire | PCB Soldering Line | 0.5h | 0.75h | 97% |
| 30 | QC & Burn-in Test | Test & QC Station | 0.25h | 0.5h | 99% |
| 40 | Pack & Label | Pack & Ship Bay | 0.1h | 0.25h | 100% |
Operation 20 also carries a Queue: 0.5h — built-in waiting time before the boards hit the soldering line. Queue time is invisible in cost math but very visible in lead time; it's part of why a 21-hour job spans 3 days.
Setup vs run — check the header math
Two kinds of time live in every operation. Setup is paid once per batch: 0.25 + 0.5 + 0.25 + 0.1 = 1.10h, exactly the header's Total Setup. Run is paid per unit: 0.5 + 0.75 + 0.5 + 0.25 = 2.00h/unit, exactly the header's Run/Unit. The distinction matters because it's why batch size changes unit economics — setup spreads thinner as quantity grows.
The Quantity Calculator
Just like the BOM page's cost explosion, the routing has a Calculate for qty box. Set it to 10 units and the totals recompute live: Total Setup 1.10h · Total Run 20.0h · Total Hours 21.1h · Est. Cost $844. The run total is simply 2.00h × 10; the setup stays fixed. Together with the BOM page's $175/unit material cost, you now have both halves of what a SmartBar actually costs to make — materials from the BOM, time from the routing.
Yields, and Why They Compound
Each card shows a yield: 98%, 97%, 99%, 100%. Read individually they look harmless; read as a chain they bite, because a unit must survive every operation. Multiply them through — 0.98 × 0.97 × 0.99 × 1.00 — and roughly 94 good units come out of every 100 started. That compounding is exactly why planners over-start batches, and why the weakest yield in a routing (here, PCB Install & Wire at 97%) is the first place to look when output falls short.
Close the Loop with Tutorial 6
Here's the satisfying part. Open WO-2025-0001 from the Work Orders tutorial — a 10-unit SmartBar order — and compare its planned operation hours against this routing's run rates:
| Operation | Routing run/unit | × 10 units | WO-2025-0001 planned |
|---|---|---|---|
| Cabinet Assembly | 0.5h | 5.0h | 5.0h |
| PCB Install & Wire | 0.75h | 7.5h | 7.5h |
| QC & Burn-in Test | 0.5h | 5.0h | 5.0h |
| Pack & Label | 0.25h | 2.5h | 2.5h |
A perfect match, line for line. The planned hours on every work order are born here — the routing is to operations what the BOM is to materials.
The Full Detail View
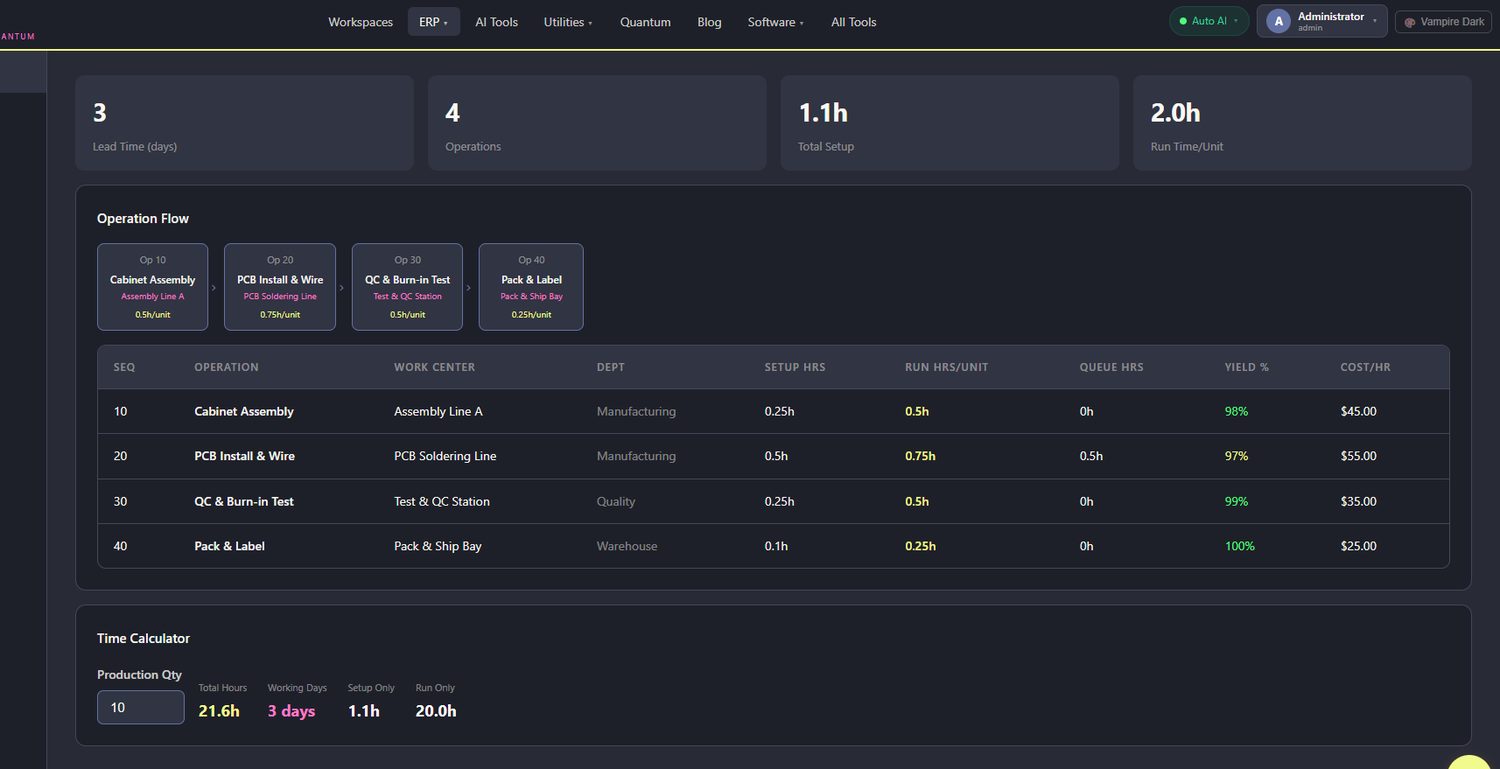
Click Full Detail and the routing opens as a complete specification — KPI cards up top (3 days · 4 operations · 1.1h setup · 2.0h/unit) and a table with two columns the flow cards don't show:
| Seq | Operation | Work Centre | Dept | Queue | Cost/Hr |
|---|---|---|---|---|---|
| 10 | Cabinet Assembly | Assembly Line A | Manufacturing | 0h | $45.00 |
| 20 | PCB Install & Wire | PCB Soldering Line | Manufacturing | 0.5h | $55.00 |
| 30 | QC & Burn-in Test | Test & QC Station | Quality | 0h | $35.00 |
| 40 | Pack & Label | Pack & Ship Bay | Warehouse | 0h | $25.00 |
Dept shows this routing crossing three departments — Manufacturing builds, Quality tests, Warehouse ships — which is a routing quietly doing organisational work: it's the formal hand-off list between teams. Cost/Hr is each work centre's rate, and it explains at a glance why the PCB Soldering Line ($55/hr, and the longest run time) dominates this product's labour cost.
The detail view's own Time Calculator holds one more lesson. At quantity 10 it reports Total Hours 21.6h · Working Days 3 · Setup Only 1.1h · Run Only 20.0h — half an hour more than the flow page's 21.1h. That extra 0.5h is exactly op 20's queue time: setup + run is what you pay for, but setup + run + queue is what you wait for. Two totals, both true, answering two different questions.
Actions
The routing carries a + Create Work Order button (same shortcut as the BOM page — a WO spawned here arrives with both structures attached). The footer repeats the vitals: Lead Time 3 days, Total Setup 1.10h, Run Rate 2.00h/unit, 4 unique work centres — those four stations get their own tutorial soon.
Try It Yourself
- Open ERP → Routings, search for "PCB" and see which routings use the soldering line.
- Flip between Flow View and Table View on RTG-001 — same data, two mental models.
- Change Calculate for qty from 10 to 100 and watch Total Hours: run scales ×10 but setup stays 1.10h — batch economics live.
- Multiply the four yields yourself and compare against how many units you’d start to safely deliver 100.
- Open Full Detail and compare its 21.6h total against the flow page’s 21.1h
- Multiply the four yields yourself and compare against how many units you'd start to safely deliver 100. #8212; then find the half hour.
Next up: Tutorial 9 — Work Centers & Capacity: the four stations these operations run on, and what happens when 130-unit S&OP work orders meet finite hours.
Comments (0)