ERP Tutorial 9 — Work Centers & Capacity: When the Plan Meets Finite Hours
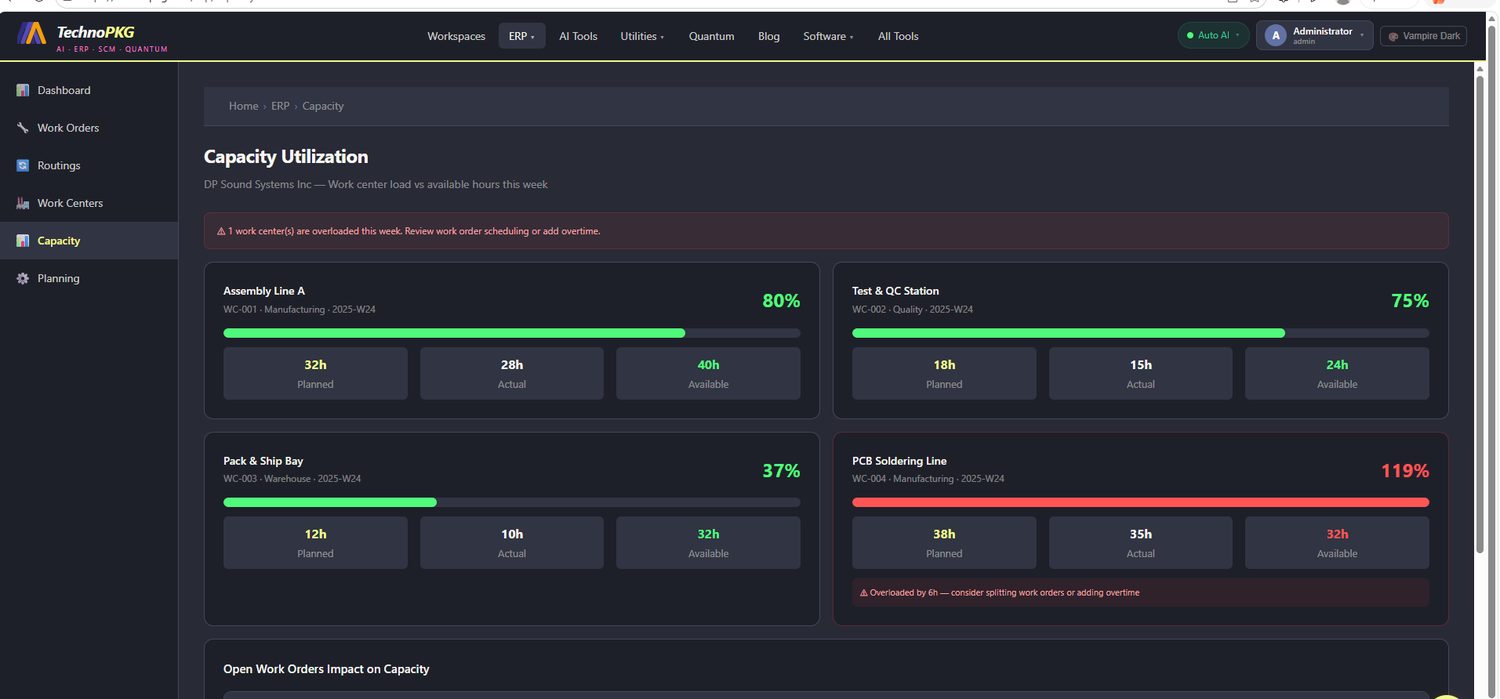
Every tutorial so far assumed the factory could absorb whatever the plan threw at it. This one is where that assumption meets reality. Open ERP → Capacity — Work center load vs available hours this week — and the page greets you with a warning banner: "1 work center(s) are overloaded this week. Review work order scheduling or add overtime."
The Four Work Centres
The routing tutorial introduced four stations by name; here they get IDs, departments, and — crucially — finite hours. Each card shows utilization as planned hours against available hours, with actuals alongside:
| Work Centre | ID | Dept | Planned | Actual | Available | Utilization |
|---|---|---|---|---|---|---|
| Assembly Line A | WC-001 | Manufacturing | 32h | 28h | 40h | 80% |
| Test & QC Station | WC-002 | Quality | 18h | 15h | 24h | 75% |
| Pack & Ship Bay | WC-003 | Warehouse | 12h | 10h | 32h | 37% |
| PCB Soldering Line | WC-004 | Manufacturing | 38h | 35h | 32h | 119% |
Utilization is simply planned ÷ available: Assembly Line A at 32/40 = 80%, comfortable; Pack & Ship at 12/32 = 37%, coasting. Three green bars — and one red one.
The Overload
The PCB Soldering Line has 38 hours of planned work against 32 available — 119%, and its card carries its own alert: "Overloaded by 6h — consider splitting work orders or adding overtime." Six hours of work this week simply has nowhere to go.
If you read Tutorial 8, this station is an old acquaintance. On RTG-001 it was already the flagged operation three times over: the longest run time (0.75h/unit), the highest rate ($55/hr), the lowest yield (97%), and the only op with queue time. Now the capacity page confirms what the routing hinted: the PCB Soldering Line is this factory's constraint. Everything the theory-of-constraints people preach starts with a page like this one — find the red bar, because the red bar sets the pace of the whole plant.
Notice also that the fix is named right on the card. Splitting a work order moves hours to another week; overtime raises the available denominator. Two levers, one decision for a planner.
Where the Load Comes From
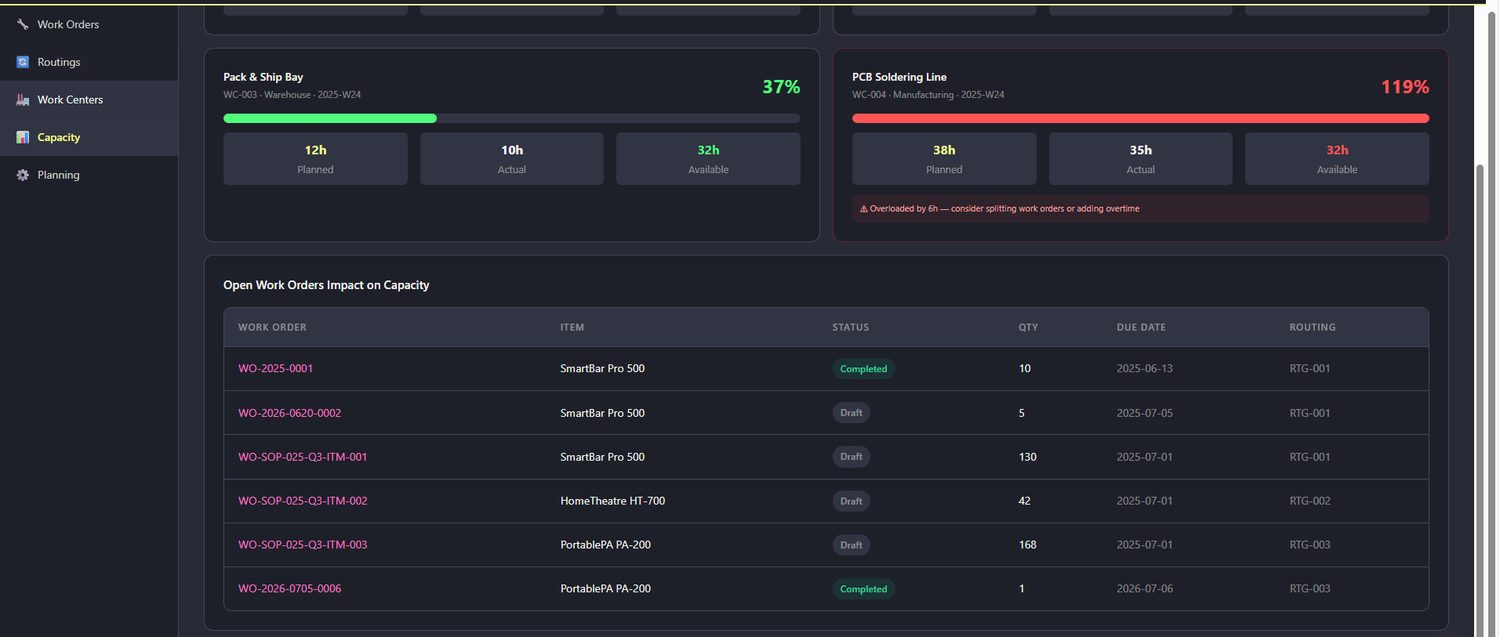
Scroll down to Open Work Orders Impact on Capacity and the page shows its working — the same six work orders from Tutorial 6, each tagged with the routing that translates its quantity into work-centre hours:
| Work Order | Item | Status | Qty | Routing |
|---|---|---|---|---|
| WO-2025-0001 | SmartBar Pro 500 | Completed | 10 | RTG-001 |
| WO-2026-0620-0002 | SmartBar Pro 500 | Draft | 5 | RTG-001 |
| WO-SOP-025-Q3-ITM-001 | SmartBar Pro 500 | Draft | 130 | RTG-001 |
| WO-SOP-025-Q3-ITM-002 | HomeTheatre HT-700 | Draft | 42 | RTG-002 |
| WO-SOP-025-Q3-ITM-003 | PortablePA PA-200 | Draft | 168 | RTG-003 |
| WO-2026-0705-0006 | PortablePA PA-200 | Completed | 1 | RTG-003 |
Here's the sobering arithmetic waiting in that table. The 130-unit S&OP order alone, at RTG-001's 0.75h/unit on the soldering line, represents 97.5 hours of PCB work — three full weeks of that station's 32-hour capacity, before the HomeTheatre and PortablePA orders add their own routings' demands. The overload on screen is this week's; the drafts in this table are the overloads of the weeks to come. This is exactly the conversation S&OP (Tutorial 5) exists to have — demand said 130, capacity says 32 a week, and someone has to reconcile them.
Planned vs Actual — the Third Number
Each card also tracks actual hours against planned: Assembly Line A has burned 28 of its 32 planned; the soldering line 35 of 38. Planned-vs-available warns you before the week; planned-vs-actual scores it during. Together with the per-operation actuals you saw on WO-2025-0001 in Tutorial 6, the system watches time at every altitude — operation, order, work centre, week.
Try It Yourself
- Open ERP → Capacity and rank the four stations by utilization — then compare against RTG-001's cost/hr rates from Tutorial 8. The most expensive station being the most loaded is not a coincidence.
- Take the 130-unit draft order and compute its hours on each of the four work centres using RTG-001's run rates. Which weeks does it need?
- Consider the two remedies on the overload card — split vs overtime — and decide which you'd pick for a 6-hour overage.
- Check Pack & Ship Bay at 37%: spare capacity is information too. What could that team absorb?
Next up: Tutorial 10 — Master Data: Items, Customers & Suppliers, the three registries every transaction in this series has been quietly referencing.
Comments (0)